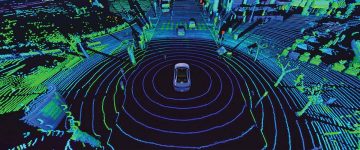

- AI and ML companies use map annotation for enhancing algorithms and refining products and services through geospatial and location-based data.
- Accurately annotated maps help in representing geographical features, enhance spatial analysis, and create visually compelling cartographic representations for geospatial analysis and informed decision-making.
- Machine learning improves map annotation precision through automated processes, achieving up to 95.36% recognition accuracy. It automates dynamic annotation, enhances concept mapping, and improves pattern recognition.
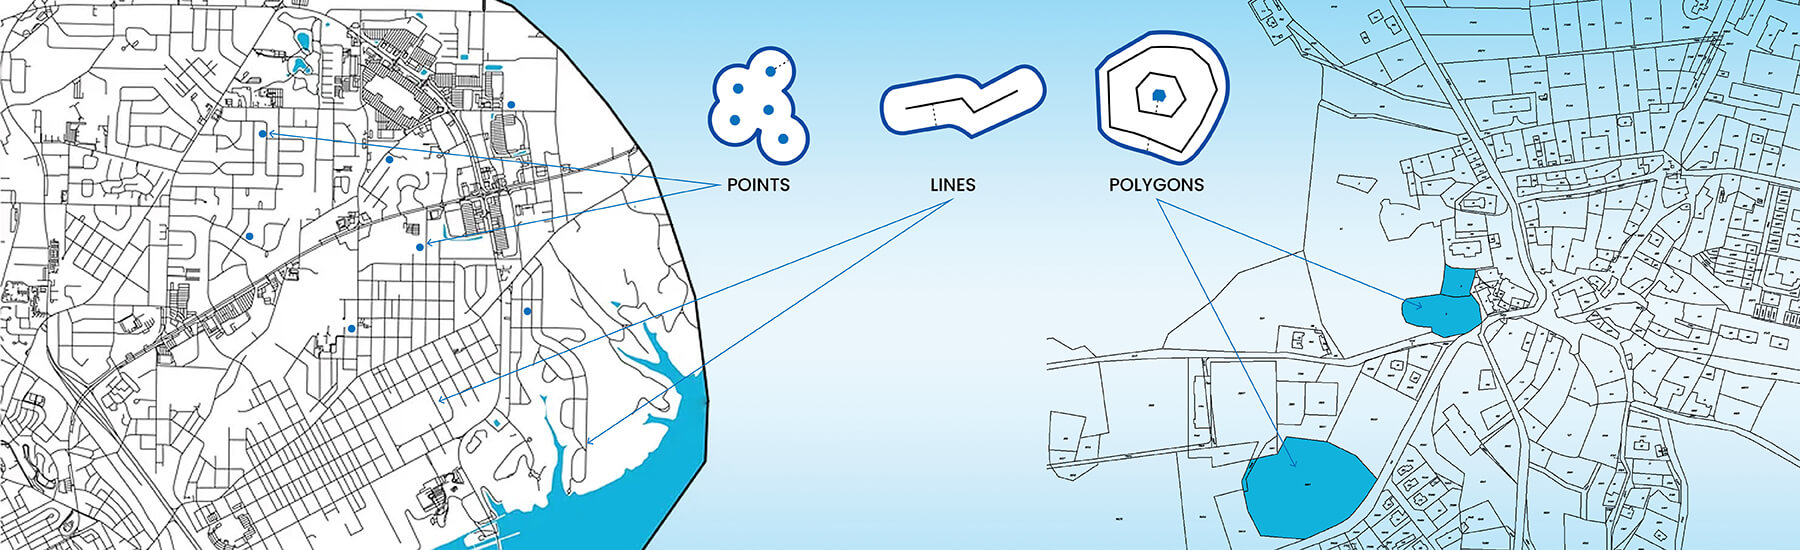
Annotating maps using points, lines, and polygons empowers your machine learning – ML models to analyze spatial data. You can use Google Maps to label geographical coordinates with point annotation. Line annotation, as part of data annotation, marks out routes and boundaries using tools like OpenStreetMap. Polygon annotations show region boundaries by enclosing them using tools like QGIS.
It provides rich metadata that your machine-learning models need to understand the context and interpret maps. Without these, your GIS applications and geospatial data analysis cannot deliver desired results. However, placing millions of points, connecting thousands of complex lines, and maintaining polygon topology is a challenging task.
As one of the leading map annotation service providers, we at HitechDigital verify every single annotation to avoid errors that can affect the understanding of ML models. Our map annotators follow stringent protocols to ensure success in map annotation. We understand that negligent map annotation has crippling effects on GIS-dependent systems like logistics, urban planning, disaster management, epidemiology, aeronavigation, real estate, marketing, and many more.
In this article, we will walk you through the process of annotating maps using point, line, and polygon techniques. We will highlight the common mistakes that Geospatial data annotation experts should avoid while annotating maps. We will also show you how to integrate annotated maps for sharing geospatial data.
Table of Contents
- Why is map annotation essential for AI and ML companies?
- How do you annotate a map?
- What Is Point Annotation in Map Data
- What Is Line Annotation in Mapping and GIS?
- What Is Polygon Annotation in Geospatial Data?
- How Machine Learning Improves the Accuracy of Map Annotation
- What are some common mistakes to avoid when annotating a map?
- Integration and collaboration of annotated maps
- What are some examples of auto annotation tools for map annotation?
- Future of point, line, and polygon techniques in map annotation
- Conclusion
Why is map annotation essential for AI and ML companies?
Accurately annotated maps help AI and ML companies to train algorithms to recognize and interpret geographical features. High-quality map annotation is important for improving the performance and reliability of AI and ML platforms in various geospatial tasks and real-world scenarios.
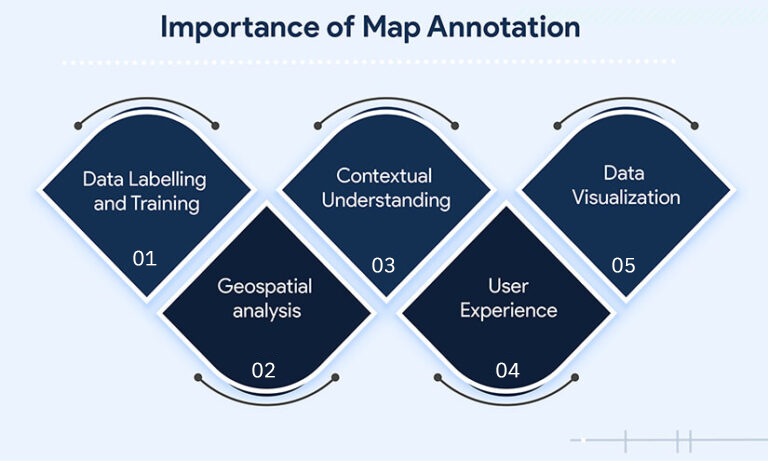
- Data labeling and training: AI and ML companies can use accurate annotations to create better training datasets. This in turn leads to improved AI and ML model performance.
- Contextual understanding: Precisely annotated maps help AI and ML companies to train their algorithms, and understand the spatial context of object detection, image recognition, or natural language processing. It improves the relationships between geographic features, and the model’s accuracy and performance.
- Data visualization: Accurately annotated maps help AI and ML companies to visualize data and communicate insights and findings to users. They can convey complex information in a clear and concise manner.
- Geospatial analysis: Annotated maps can provide the necessary context and reference data for these analyses. It enables AI and ML companies to develop more accurate and reliable solutions.
- User experience: AI and ML companies use annotated maps to develop location-based services or applications. It helps them provide clear and informative visualizations that enhance user experience.
How do you annotate a map?
Add descriptive information, labels, symbols, or other visual elements to annotate maps. This enhances its readability, provides context, and conveys essential information about geographic features. There are three primary techniques for annotating maps: point, line, and polygon. Each technique serves a specific purpose and represents different types of geographic features.

What Is Point Annotation in Map Data
Our experts gather necessary data and satellite imagery of the fields to annotate maps. We use GIS (Geographic Information System) software and other tools needed to annotate the map. Here’s what you need to know about point annotation.
What Do Points Represent on a Map?
Points in a map refer to specific locations or features represented by a single coordinate pair (latitude and longitude). Icons, markers, or pins represent points in a map and provide extra information about the location.
Which Features Can Be Labeled Using Point Annotation?
It is widely used to mark and annotate distinct places on a map, such as landmarks, points of interest, or specific geographical features. This includes:
- Marking locations of cities or towns
- Identifying points of interest such as tourist attractions or historical sites
- Representing specific geographical features like mountain peaks or water sources
What Are the Best Practices for Accurate Point Annotation?
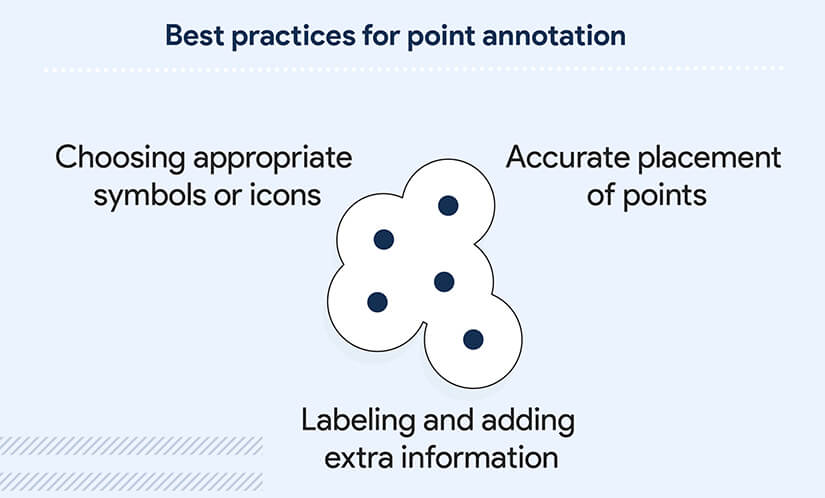
- Choosing appropriate symbols or icons: It helps users to understand represented features. Selecting clear, easily recognizable symbols or icons ensures that the map is visually appealing. It helps in conveying the intended information.
- Accurate placement of points: It ensures the correct representation of locations and features. It ultimately leads to better performance of AI and ML platforms that rely on precise geospatial data. Misplaced points lead to confusion and errors in analysis. This makes it crucial to carefully place points during the annotation process.
- Labeling and adding extra information: It provides context and clarity about represented features. It enhances the map’s usability and effectiveness for AI and ML platforms. Proper labeling ensures that users can easily understand and interpret spatial data. This makes it an essential aspect of map annotation.
Examples and use cases of point annotation
- Navigation and routing: Identify locations, landmarks, and points of interest to navigate and route autonomous vehicles.
- Disaster management: Identify critical infrastructure and resources for efficient resource allocation during natural disasters or emergencies.
- Urban planning: City planners can visualize and analyze the distribution of public transportation stops, parks, and schools for urban development.
- Environmental monitoring: Representation of pollution sources, protected areas, or wildlife habitats to track and manage environmental issues.
- Tourism and travel: Highlight tourist attractions, accommodations, and restaurants for travelers to plan their trips and explore new destinations.
Unlock precision. Harness the power of point annotation techniques.
Enhance the quality and accuracy of your map annotation projects.
What Is Line Annotation in Mapping and GIS?
We use line annotations to depict linear features. It includes drawing lines on the map to represent trails, paths, and rivers within the reserve. We use different line styles and colors to differentiate between various types of linear features. Our map annotators use dashed lines for trails and solid lines for rivers. Here’s a complete understanding of line annotation.
What Do Lines Represent on a Map?
Lines on a map are graphical representations that connect two points, displaying features like roads, rivers, borders, and contours. They provide vital information about connectivity, boundaries, and elevation changes. Map lines help in understanding spatial relationships. It enables accurate navigation and analysis in cartography, geography, and urban planning.
What Features Can Be Annotated Using Lines on a Map?
- Grid lines: Horizontal and vertical lines on a map form a grid system of meridians of longitude and parallels of latitude. It helps in locating positions relative to the Equator, North, or South.
- Meridians: Imaginary lines that run north and south on a map, from pole to pole, represent degrees of longitude. They determine how far east or west a place is from the prime meridian.
- Parallels: Imaginary lines that run east and west on a map, represent degrees of latitude, and determine how far a place is from the equator.
- Contour lines: Faint lines that connect points of equal elevation above sea level illustrate the shape of the terrain. They show the topography of the land.
Top Best Practices for Line Annotation in Geospatial Mapping
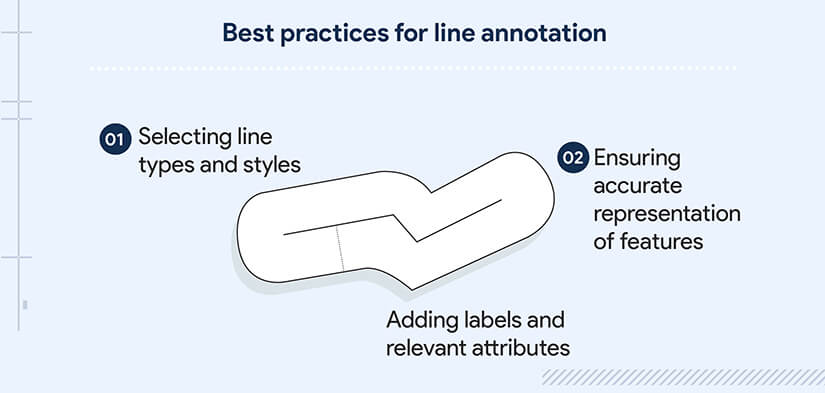
- Selecting line types and styles: It ensures a clear representation of various features and enhances map readability. It helps the users to differentiate between features such as roads, rivers, or boundaries. It improves the effectiveness of the map for AI and ML platforms that rely on accurate geospatial data.
- Ensuring accurate representation of features: Accurate presentation of roads, rivers, or boundaries improves the quality of the map. Such maps are more useful for AI and ML platforms in tasks like navigation, urban planning, and disaster management.
- Adding labels and relevant attributes: The context and clarity of features improve the usability and effectiveness of maps for AI and ML platforms. Proper labeling helps users to understand spatial data, making it an essential aspect of map annotation.
Examples and use cases of line annotation
These examples show why line annotation is important for various applications, including:
- Transportation networks: To represent roads, highways, railways, and other transportation routes for users to navigate and plan travel routes.
- Hydrological features: Depict rivers, streams, and canals to provide information for water management, flood control, and environmental monitoring.
- Political boundaries: Showcase national, state, or local boundaries to understand jurisdictional limits and administrative divisions.
- Utility networks: Illustrate power lines, pipelines, and other utility infrastructure to assist the planning, maintenance, and management of these networks.
- Contour lines: Drawing contour lines on topographic maps, showing elevation changes and the shape of the terrain, widely used for hiking, land use planning, and geological studies.
Tools and software for line and point annotation
Some of the popular tools and software used to mark specific locations or features on a map using points and lines include:
- QGIS: An open-source Geographic Information System (GIS) software that allows users to create, edit, and analyze geospatial data using point and line annotations.
- ArcGIS: A comprehensive GIS software suite developed by ESRI, which offers various tools for creating, managing, and analyzing geospatial data, including point and line annotation.
- Google Earth Pro: A powerful mapping and visualization tool that allows users to create custom maps with point annotation, lines, and polygons.
- Mapbox: A platform that provides tools and APIs for creating custom maps and adding point annotation, lines, and polygons to enhance the map’s interactivity and functionality.
- OpenStreetMap: A collaborative, open-source project that allows users to create and edit map data, including point and line annotation, using various editing tools like iD editor and JOSM.
Transform your maps with pointed accuracy and seamless precision.
From marking key locations to tracing features, leverage the power of point, line and polygon annotation for precision mapping.
What Is Polygon Annotation in Geospatial Data?
Polygons in a map are closed shapes used to represent geographic areas or regions, such as city boundaries, lakes, or forests. We annotate maps using Polygons to help our clients measure the area and perimeter of geographic features. Our annotated maps provide valuable information for land use management and environmental monitoring. Here’s the complete know-how on polygons.
What Do Polygons Represent on a Map?
Polygons in map annotation are formed by connecting multiple lines and enclosing a specific region on the map. These are used in cartography, GIS (Geographic Information Systems), and spatial analysis to depict and analyze land use, administrative divisions, and other spatial patterns.
What things can be represented by polygons?
Polygons can represent a wide range of geographic features and spatial phenomena. Here are some examples:
- Countries and administrative boundaries: Represent the boundaries of countries, states, provinces, and other administrative divisions.
- Cities and urban areas: Depict the spatial extent of cities, towns, and urbanized regions.
- Parks and natural reserves: Represent the boundaries of national parks, wildlife reserves, and protected areas.
- Bodies of water: Showcase lakes, rivers, oceans, and other water bodies on a map.
- Land use and land cover: Represent different types of land use, such as agricultural fields, forests, residential areas, and industrial zones.
- Infrastructure and transportation: Depict roads, highways, railways, airports, and other transportation networks.
- Boundaries of regions or districts: Define the boundaries of specific regions, districts, or neighborhoods.
- Geographical features: Represent mountains, valleys, plateaus, and other topographical features.
How to Accurately Annotate Maps Using Polygon Annotation
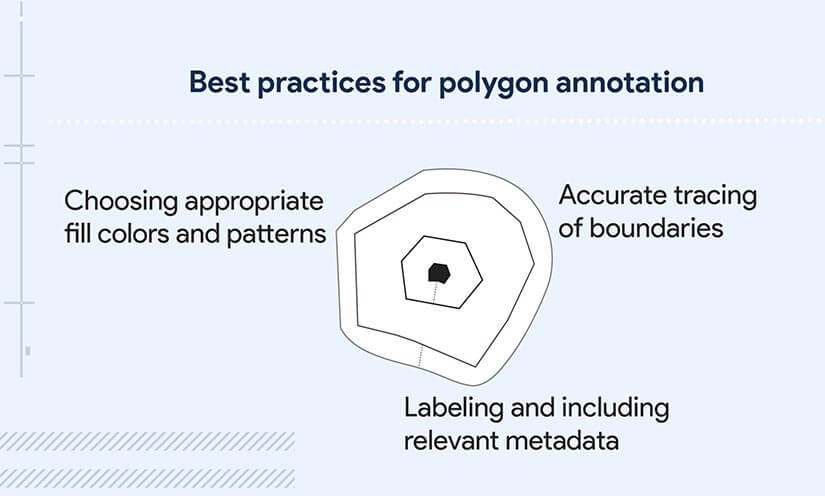
- Choosing appropriate fill colors and patterns: Select meaningful colors and patterns that reflect the theme and purpose of the map. It helps in differentiating geographic areas or regions.
- Accurate tracing of boundaries: Properly traced boundaries improve the overall quality of the map. It is useful for various applications like navigation, urban planning, and disaster management.
- Labeling and including relevant metadata: It provides context and clarity to the represented geographic areas or regions to help users understand and interpret the spatial data.
Examples and use cases of polygon annotation
Some prominent examples of using polygon annotation for maps include:
- Administrative boundaries: Represent city, state, or country boundaries, helping users understand jurisdictional limits and administrative divisions.
- Land use and zoning: Depict different land-use zones, such as residential, commercial, or agricultural areas, providing valuable information for urban planning and development.
- Natural features: Illustrate geographic areas like forests, lakes, or deserts, aiding in environmental monitoring and conservation efforts.
- Climate and weather data: Display areas affected by specific weather conditions or climate zones, helping researchers and policymakers monitor and manage climate-related issues.
- Population density and demographics: Represent areas with specific population densities or demographic characteristics, providing insights for social and economic planning.
These examples demonstrate the importance and versatility of polygon annotation for maps in AI and ML platforms that rely on accurate geospatial data for tasks like navigation, urban planning, and disaster management.
Tools and software for polygon annotation
As I mentioned earlier, the choice of a Polygon annotation tool depends on specific project requirements, budget, user interface preferences, and integration capabilities with other workflows. Here are a few examples of the tools and software available for polygon annotation:
- Labelbox: This versatile polygon data annotation platform provides a user-friendly interface and collaboration features for creating and editing polygons on maps and images.
- RectLabel: This tool is specifically designed for image and video annotation and offers polygon annotation capabilities along with other annotation shapes. This makes it suitable for various computer vision tasks.
- CVAT (Computer Vision Annotation Tool): The open-source annotation tool allows users to annotate polygons on images and videos. This makes it a flexible option for different annotation needs.
- ArcGIS Pro: The powerful GIS software offers comprehensive mapping and spatial analysis capabilities, along with creating, editing, and managing polygons. This makes it suitable for complex geospatial annotation tasks.
- QGIS: The free and open-source GIS software offers a wide range of features for data editing and spatial analysis. This makes it a popular choice among GIS professionals.
- SuperAnnotate: This AI-powered annotation platform combines manual and automated annotation features. It allows users to efficiently annotate polygons on various types of data.
- Alegion: This data labeling platform provides a collaborative environment for teams to annotate polygons on maps and images, with quality control and project management features.

The Future of Data Annotation: Key Trends and Innovations
- Industries globally are impacted by advancements in annotation.
- Smart tools and techniques enhance the performance of ML models.
- Synthetic data and multimodal annotation are trends that will dominate.
- Ethical data annotation practices ensure responsible AI development.
How Machine Learning Improves the Accuracy of Map Annotation
Employing machine learning can enhance map annotation accuracy by leveraging algorithms to automate or assist the annotation process. These results in more precise and efficient annotations.
- Enhanced recognition accuracy: Machine learning models, such as dense convolution networks, can achieve high recognition accuracy in tasks like annotation character recognition, with rates up to 95.36%.
- Efficient and high-quality data collection: Machine learning can address the challenge of efficiently collecting and annotating large-volume datasets for high-definition (HD) maps, ensuring high-quality annotations.
- Automatic and dynamic data annotation: Machine learning techniques can automate the annotation process, reducing the need for manual annotation or hiring annotators, leading to more accurate and consistent annotations.
- Concept mapping: Machine learning systems can identify critical information within data sources, such as clinical notes, and map phrases to relevant concepts of interest, improving the accuracy of map annotations.
- Pattern recognition and predictions: Machine learning algorithms can recognize patterns and make predictions based on large amounts of labeled data, enhancing the detection of map features and points of interest.
What are some common mistakes to avoid when annotating a map?
Avoid inaccurate placements, inconsistent labeling, incomplete annotations, and disregarding data context. Here, we have listed some of the common mistakes that our human annotators avoid at any cost:
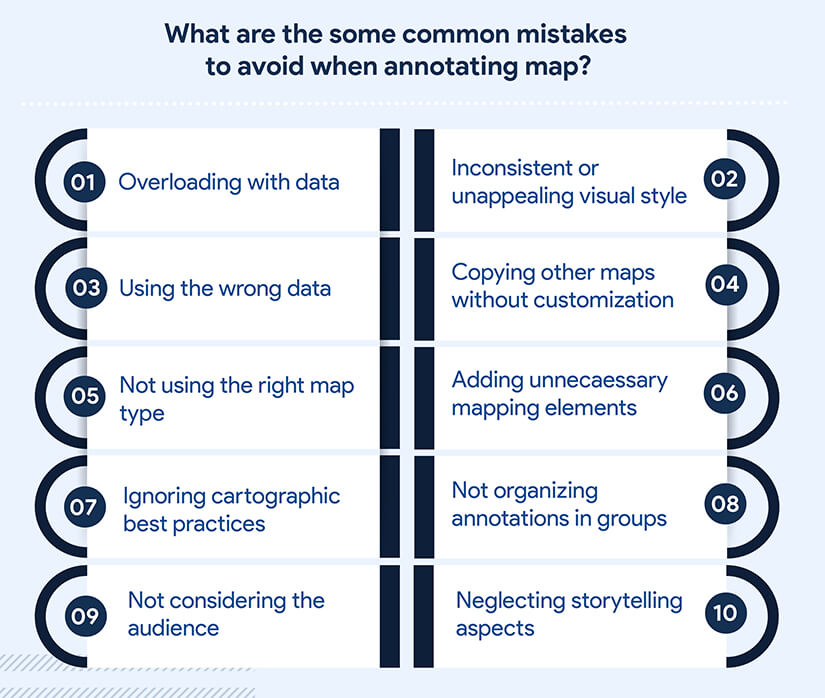
- Overloading with data: Avoid showing too much data on the map, as it can lead to confusion and make the map difficult to read.
- Inconsistent or unappealing visual style: To engage the audience and convey the intended message, ensure that your map has a visually appealing and consistent style.
- Using the wrong data: Choose the appropriate data for your map to make a meaningful impact on your audience.
- Copying other maps without customization: Instead of replicating existing maps, explore different options and customize your map to suit your specific needs and objectives.
- Not using the right map type: Experiment with various map types to find the best one for your purpose.
- Adding unnecessary mapping elements: Refrain from including extraneous elements that do not contribute to the map’s purpose or message.
- Ignoring cartographic best practices: Familiarize yourself with standard cartographic best practices to create accurate and effective maps.
- Not organizing annotations in groups: Organize your map documentation into annotation groups for better management and easier editing.
- Not considering the audience: Tailor your map annotations to the intended audience, ensuring that the information is relevant and easily understood.
- Neglecting storytelling aspects: Use annotations to convey narratives and context, making maps more engaging and informative.
Integration and collaboration of annotated maps
Integration and collaboration of annotated maps are crucial aspects in the modern geospatial landscape. As the world becomes increasingly interconnected, the need for seamless sharing and collaboration of spatial data grows. Cloud-based platforms and open-source mapping tools facilitate real-time collaboration among cartographers, GIS professionals, and stakeholders, enabling them to work on a single, unified map.
- Sharing annotated maps Cloud based platforms: Cloud-based platforms foster integration and collaboration among geospatial professionals. These platforms enable real-time editing, version control, and secure data storage, allowing users to work together seamlessly. By leveraging cloud technology, the geospatial community can create richer, more informative maps that drive informed decision-making.
- Real-time data sharing with platforms providing interactive web maps: Real-time data sharing enhances integration and collaboration in the geospatial field. These platforms allow users to visualize, edit, and share spatial information instantly, fostering efficient communication and decision-making. Interactive web maps empower users to collaborate effectively, leading to more accurate and comprehensive geospatial insights.
- Version control and managing updates: It is an essential aspect of integrating and collaborating on annotated maps. These features ensure that map annotations remain accurate and up to date, preventing data conflicts and redundancies. By effectively managing versions and updates, geospatial professionals can maintain high-quality, reliable maps that facilitate informed decision-making.
Social media and crowdsourcing have also emerged as powerful tools for map annotation, allowing users to contribute valuable local knowledge and insights. By fostering integration and collaboration, annotated maps become more accurate, comprehensive, and useful, ultimately driving better decision-making and fostering a greater understanding of our world.
Catapult your AI models to new heights.
Discover the top 5 data annotation strategies in our must-read article to elevate your data annotation game.
What are some examples of auto annotation tools for map annotation?
While auto annotation tools for map annotation are not as prevalent as those for image annotation, some tools and techniques can be adapted for map annotation purposes:
ArcGIS: ArcGIS offers various tools for creating and editing map annotations, such as the Follow Feature tool, which constrains annotation location relative to feature edges.
To keep their database relevant, accurate, validated and updated, real estate portal approached us for GIS mapping 20,000 brochures with parcel information in an online platform that delivered detailed and accurate property listings.
Crowdsourced data: Platforms like OpenStreetMap rely on user-generated content and real-time updates to enhance map accuracy and relevance. This approach can be seen as a form of auto annotation, as users contribute annotations to the map collectively.
Machine learning algorithms: Adapting pre-trained algorithms used in image annotation tools, such as object detection and segmentation models, can be applied to map annotation tasks, especially for identifying and annotating geographic features.
Points of Interest (POI) discovery: Techniques like discovering new POIs from user-generated map annotations can be considered a form of auto annotation, as it leverages existing annotations to identify and label new features on the map.
Future of point, line, and polygon techniques in map annotation
The future of point, line, and polygon techniques in map annotation is promising. Incorporating dynamic point, line, and polygon annotations on maps can revolutionize how we analyze and communicate spatial information. Also, with advancements in AI and ML, these techniques are becoming increasingly sophisticated and user-friendly; empowering users to unlock the full potential of geospatial data.
The integration of AI and machine learning will revolutionize how we annotate maps, enabling real-time updates and personalized experiences. Automated feature extraction, real-time updates, and integration with emerging technologies like augmented reality will enhance the user experience. The future of point, line, and polygon techniques in map annotation involves:
- Follow Feature tool: It relates and improves annotation location relative to feature edges.
- Place-based annotation: Transition from classic GIS to place-based representations reflecting language and culture.
- Automatic image annotation: Utilizing pre-trained algorithms to assist manual annotation, especially for complex tasks like segmentation and object detection.
- 3D mapping and geospatial analysis: Advances in 3D scanning and modeling technologies will enable highly accurate 3D maps for various applications, such as navigation, virtual tours, urban planning, and immersive gaming experiences.
- Crowdsourced data: Map providers will increasingly rely on crowdsourced data, user-generated content, and real-time updates to enhance map accuracy and relevance.
These advancements will not only improve the accuracy and efficiency of map annotation but also create new opportunities for collaboration and data sharing among professionals and enthusiasts alike. As technology continues to evolve, the future of point, line, and polygon techniques in map annotation is undoubtedly bright.
Conclusion
In conclusion, the use of point, line, and polygon techniques in map annotation offers immense benefits for spatial analysis and communication. These techniques empower users to convey complex information effectively and enhance our understanding of geographic data. By leveraging advancements in machine learning and AI, map annotations can provide valuable insights and aid in decision-making processes.
As we move forward, it is crucial to explore and harness the full potential of these techniques to unlock the power of geospatial data. With continuous innovation and evolving technologies, the future of annotating maps using point, line, and polygon techniques holds great promise for a more informed and visually compelling spatial narrative.
Fuel precision. Drive AI excellence.
Experience the power of high-quality map annotation services!