Client Profile.
The client is a New York-based real estate data aggregator for residential and commercial properties. They deliver in-depth and borough-wise information on properties in the US across multiple attributes. Through in-depth intelligence and analytical insights, they enable users to make informed decisions related to property purchase, sale, rental, etc.
Business Need.
In order to increase enhance user experience, the client was looking to offer an interactive and intuitive property dashboard on its portal. This would give users access to hundreds of thousands of property records with pricing data in a structured and standardized format. The analytics-driven dashboard would deliver intelligent price insights across property types and locations at a macro or granular level.
The real estate aggregator hence partnered with HitechDigital to prepare an interactive dashboard to offer users a drilled down, filtered or holistic view of property price data across parameters.
Challenges.
- Accessing and simplifying data available in different formats and structures
- Integrating data from multiple real estate databases into a centralized data warehouse
- Addressing duplicate records and outliers which would adversely impact analytics
- Creating an intuitive dashboard that can be managed from any device.
Solution.
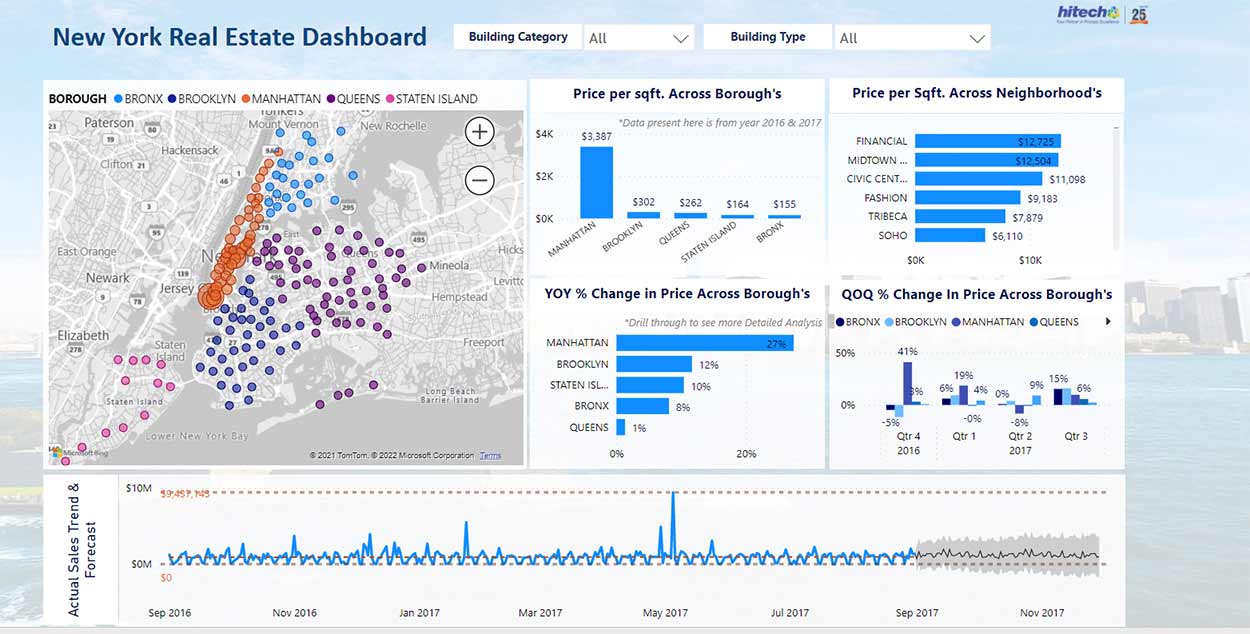
We delivered an interactive, easy-to-use and query-based dashboard that allowed users to monitor property data and analytics against multiple attributes/trends. The dashboard was driven by Power BI.
It was enabled with user-based rights and had drill-down provisions for granular tracking of property features, location, performance and behavior. Analytical insights and comparative data empowered users with informed and strategic buying/selling decisions.
Approach.
- Finalized and documented key KPIs/metrics as well as the attributes that needed to be accounted for in the reporting analytics.
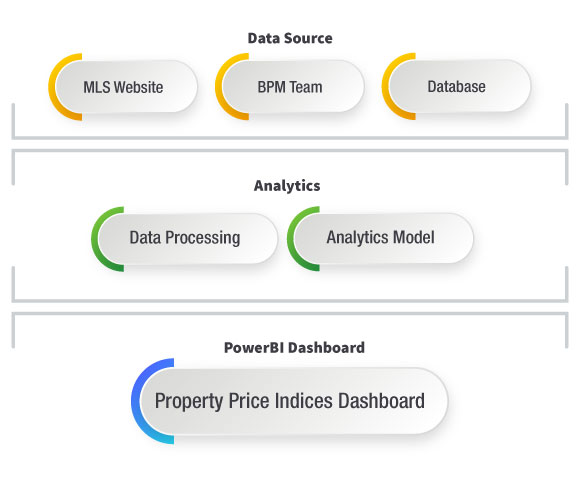
- Gathered input data from the client database using a secured API-key based authentication. To maintain near real-time status, this input data was refreshed every 24 hours.
- Integrated data from different sources, pre-processed the data (standardized and cleansed) and identified the best suited data analytics model.
- Created an intuitive, easy-to-understand and engaging dashboard to show property information against multiple parameters along with:
- Real-time charts related to pricing trends, sales trends, neighborhood, and geography
- Easy to navigate filters for building categories like residential, commercial and need-based types like condos, apartments, rentals, etc.
- Accurate and instant comparison matrix based on historical data trends
- User-based access for different roles
- Customized alerts to users based on their previous search history
- Optimized the dashboard for both: web and mobile users to reach out to a wider audience.
- Delivered solution to client while meeting all defined expectations achieving a 100% “First Time Right.”
- Tools and Technology Used: Custom crawlers, Power BI, SQL-based database and IDX

Business Impact.
Centralized and easy availability of all reports increased operational efficiency for client
Enhanced visibility across property data improved user experience
Accurate demand forecasts by leveraging historic data and market trends
Facilitated real-time property analytics with current and accurate intelligence on property behavior and trends