Client Profile.
A U.S.-based company with a revenue of over $1 billion, manufacturing and selling products from 10+ global locations.
Business Needs.
The company was looking to control profit margin shifts across manufacturing units in different regions of Asia, Europe and the U.S.
Historically margin comparisons and analysis was a 6-monthly process.
The requirement was a visibility and analytics solution that helps to perform margin comparison and analysis on an on-demand basis.
Challenges.
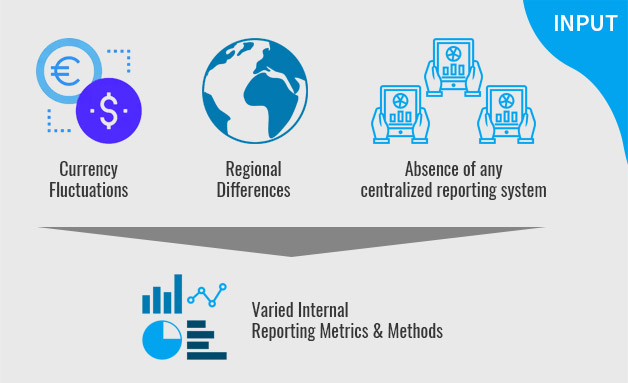
Currency fluctuations, regional differences in financial reporting methods and absence of any centralized financial reporting systems made integrating data on business unit performance, types of fixed and variable costs, customer billings and product volume, etc. quite challenging.
Varied internal reporting metrics, reporting methods and formats used by 50+ financial managers and heads across locations made it difficult to consolidate data, as a lot of differences were present across parameter names, values, units, etc.
Difficulties in data accessibility rose from issues such as sharing of periodic updates on revenue and profit metrics only with stakeholders physically present during meetings.
Approach.
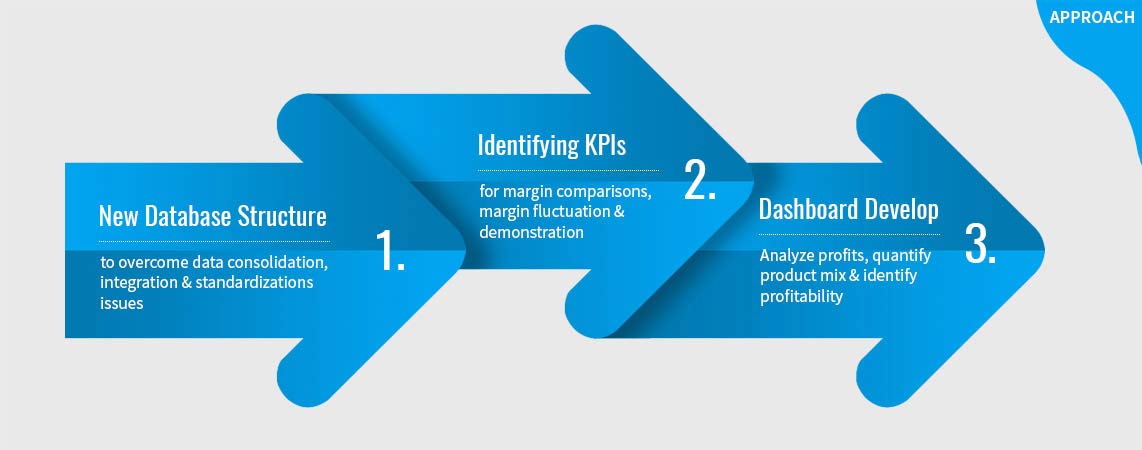
Creating a new database structure to overcome data consolidation, integration and standardizations issues. This included
- Enabling data consolidation across any number of sources on profit margins, sales, fixed and variable costs, customer billings, across sites, time, products, customers, etc. as well as fluctuations and variances across units across locations.
- Making the data ready for processing with a user portal to address any issues encountered during incremental data transfer.
- Creating a solution for semi-automated data cleansing, organization and integration.
Identifying the right KPIs for
- Margin comparisons across manufacturing units across different time periods.
- Demonstrating the drivers for margin fluctuation.
- Demonstrating most profitable products, most profitable customers and segments.
Developing a dashboard to generate real-time, historical and trend-based analytical reports and insights to improve performance per unit, per customer and product. And allow users to
- Compare and analyze profit margins and shifts across manufacturing sites as and when required.
- Quantify product mix at product level.
- Identify net profitability contribution by customer segment, and further break the numbers down to the individual customer level.
Solution.
Developed a business analytical tool that allows
- Tracking performance by production location, customer and product type.
- Drilling down to know the products the customer is using, billings by offering as well as profit at individual customer and product level.
- On-demand automated analytical reporting to show drivers for margin fluctuations, showing patterns and trends along with alerts and actionable insights.
- Alerts to track estimated vs actual comparison of costs / margins.
- High-level narratives and powerful reporting to enhance clear, precise communication of information.
- Accessibility of dashboard to authenticated users across locations via a cloud visualization solution.