

- Excel surpasses Power BI in familiarity, ease of use, ad-hoc analysis and calculations, as well as cost and accessibility, since it is included in MS Office.
- Power BI is preferred over Excel for handling large datasets and scalability, data visualization and interactivity, as well as collaboration and sharing.
- Power BI is best for businesses that need advanced data visualization and direct connections with multiple data sources. On the other hand, Excel is better suited for spreadsheet-based tasks and working with smaller datasets.
Which data tools do you use to manage, analyze and visualize data? Do you primarily use dashboards or spreadsheets? Where and when? Maybe it’s time to reassess your team’s data tools, strategies, and the quality of data analysis given the way data has taken center stage in every business operation today.
This naturally leads us to compare spreadsheets and dashboards for the purposes of using, visualizing, and interpreting data. Such a comparison will also show which tools can help in extracting actionable insights from data in a time- and cost-optimized manner, and which ones make more sense in a specific scenario.
And in this, we cannot afford to ignore either Excel or Power BI.
So, in this article we’ll be taking a look at:
- Strengths and limitations of Excel
- Strengths and limitations of Power BI
- Comparison: Power BI vs Excel
- Where Excel scores over Power BI
- Where Power BI scores over Excel
Strengths and limitations of Excel
Strengths of Excel
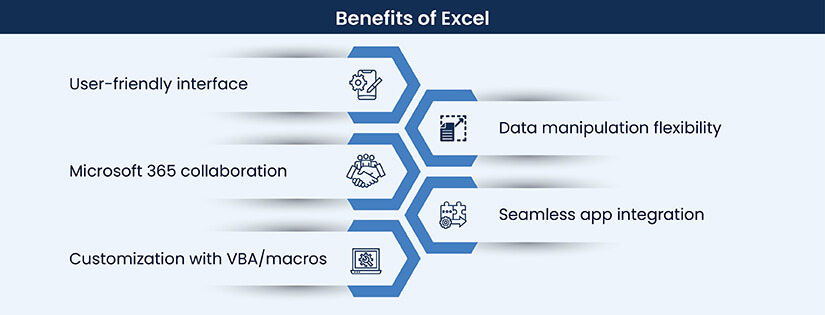
Ease of use and familiarity:
Organizations which rely heavily on spreadsheets and Excel consider both these factors. Excel has an intuitive interface and people with all levels of experience can handle Excel. Most people have been using Microsoft apps on their PC/laptops for long, so it is familiar and convenient to them.
For MS Office 365 users, it comes at no extra cost. Many business users continue to rely primarily on spreadsheets as it doesn’t need any specialized training in SQL or other database systems.
Versatility in data manipulation and analysis:
Excel offers immense versatility, features and flexibility for conducting manual data analysis. It has an impressive range of functions and features to manipulate data, analyze and visualize it. It can use pivot tables, charts, conditional formatting, and formulas. Being extremely user-friendly, it allows different teams to share and perform thousands of simple data related tasks.
Collaboration through Microsoft 365:
With Microsoft 365, users can now easily collaborate and work on the same Excel file in real-time. It is called co-authoring. Changes are reflected instantaneously, and you can also color code other people’s selections.
Integration with other applications:
Whether it is Salesforce, Google Sheets, Outlook, CSV, or web scrapers, MS Excel is compatible with many tools and allow seamless data transfer. Such smart Excel integrations help organizations to conduct quick data analysis, find new insights and boost efficiency.
Customizability with VBA and macros:
Visual Basic Application (VBA) is vital for users handling a huge amount of data. With customization available in VBA and macros, processing data in Excel becomes easy, as users can automate processes with custom functions. It helps to reduce the stress of repetitive tasks, long formulas, and turnaround time.
Limitations of Excel
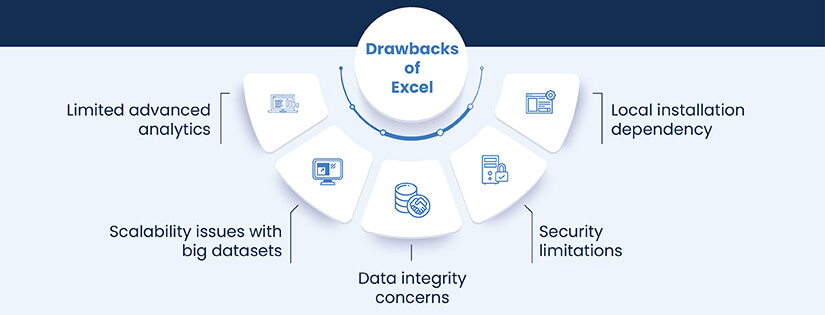
Limited advanced analytical capabilities:
Excel offers limited scope for advanced analysis or data modeling. Also, Excel works mostly in two-dimension and cannot give accurate results when we need to account for multiple scenarios. This can be in projecting demand, downtime, rise of production costs, and other critical business areas.
Scalability issues with large datasets:
Working on Excel with substantial amounts of data is frustrating. It works on pre-adjusted forms with limited data. It has a maximum row limit of 1,048,576 rows. It usually slows down and becomes unresponsive as the file size keeps increasing.
Also, speed of iteration, performance degradation, lack of memory and computer crashes often create issues in data wrangling and management with Excel.
Data integrity concerns:
It is very easy to make mistakes in Excel. Whether the causes stem from human, functional, outlier or programming errors, Excel spreadsheets have reliability issues. Also, Excel does not have any built-in data validation or version control tools.
According to a study, about 88% spreadsheets carry human and programming errors and have capacity limitations. Spreadsheet errors can occur because of the use of faulty logic. It can also be due to incorrectly copied formulas, improper use of built-in functions or simply because of mistakes in data inputs.
Security limitations:
The sensitive data in Excel spreadsheets can be downloaded and then stored on local computers. As employees can freely use or store this data, it is prone to causing noncompliance, loss of data, and abuse of vulnerabilities. Even though Excel has password protection and encryption, it is less secure than dedicated database management systems.
Dependency on local installations:
Installations of Excel on local machines make it difficult for team debugging, and to follow best practices. Excel files are usually saved locally or on shared drives. Once spreadsheets are shared within teams, it also becomes difficult to identify the correct/latest version.
In spite of these limitations, Excel is still relevant. Most large organizations are still unused advanced analytics tools and 62% of them still rely on spreadsheets.
However, a Deloitte study suggests that companies with data-driven cultures are 77% more likely to succeed. It is here that tools like Microsoft Power BI, come into play.
Strengths and limitations of Power BI
Recognized as the 2022 Magic Quadrant Leader for the 5th year consecutively, Microsoft Power BI is an interactive data visualization software suite. It is designed to aggregate, organize, and analyze data.

Strengths of Power BI
Advanced data visualization options:
Power BI offers an extensive range of visualization options for comparison, correlation, distribution, ranking, etc. to view your data from every possible side. Plus, it allows the creation of custom visualizations. You can use maps to track progress, personalize dashboards and interfaces, create interactive reports and send alerts.
Seamless data integration from various sources:
Power BI easily connects with data sources, including Excel workbooks, databases, data warehouses, Microsoft Power Platforms and 300+ other data sources. It can connect to on-premises and cloud-based sources as well as handle relational, non-relational, structured and unstructured data.
User-friendly interface:
Power BI has a user-friendly interface. It is highly visual and offers attributes to create beautiful reports and dashboards. With drag-and-drop features, self-service capabilities, Power BI can be used by employees with varying levels of experience.
Collaboration and sharing through cloud-based service:
Give people access to your reports and dashboards to make changes in real-time with Power BI. It facilitates real-time collaboration between teams – without any glitches and with high security.
Scalability for large datasets and big data:
Power BI has been specifically designed to manage large amounts of data. It stores data in a highly compressed memory cache for optimized query performance and user interactivity. With more speed and flexibility to work on any size of data, companies find Power BI useful for scalability.
Built-in support for advanced analytics:
If you want to predict demand of your products or analyze customer sentiment about your services, Power BI helps to leverage advanced analytics. It helps you make data-based decisions across all aspects of your business. It supports predictive modeling, natural language processing, and machine learning.
Limitations of Power BI

Limited customization compared to other tools:
As compared to advanced customization found in other business intelligence tools for dashboards and visualizations, Power BI offers limited options in this context. It is a great fit for Microsoft-centric environments, but may not support visualization with programming languages like R.
Cost considerations:
Currently, Power BI Desktop is offered for free, while Power BI Pro is charged around $10 per user per month. There are several hidden costs of Power BI for implementation, operations, user adoption, and training.
Steeper learning curve for advanced features:
Because of DAX, Power BI has a steep learning curve even with online self-help resources and training modules. It also requires in-depth knowledge of Power Query and Power Pivot DAX formulas and ways to use them.
Dependency on Microsoft ecosystem:
Power BI consists of several tightly integrated software, services, and cloud components. With advanced features, it has its appeal as an enterprise level-reporting platform. With features, add-on services, licenses, capacities, training, etc. it gets tough and there are incompatibilities with non-Microsoft tools.
Data refresh limitations for free users:
Importing data from its several sources into a dataset is known as refresh for Power BI. It is based on the refresh schedule or on-demand. Data refresh in Power BI is limited to eight daily dataset refreshes. If the user plan is premium, up to 48 daily refreshes are allowed.
Comparison: Power BI vs Excel
| Item | Power BI | Excel |
|---|---|---|
| Excel | Requires knowledge of Power Query and Power Pivot DAX formulas to use. | Basic knowledge of Excel is easy to acquire. Easy to learn for starters. |
| Working Flexibility | Power BI is difficult to learn, especially if you are new to it. It uses the Microsoft environment. | Excel is flexible to use and create summary reports in simple steps and formulas. |
| Visuals | Highly visually appealing. | Limited visual options. |
| Chart Customization | Limitations to customize a chart fully. | Can customize charts to any extent. |
| Dashboard Interactivity | Provides slicers, filters, cross filters, visual level filters, report level filters and drill-through filters for interactivity. | Has only slicers for dashboard interactivity. |
| Size of the Data | Can manage enormous amounts of data | Struggles with large amount of data. |
| Formula Language | Runs on DAX for its formulas and functions. | Runs on MDX language for its formulas and functions. |
| Data Security | Can restrict data view and sharing to individuals. | Once the dashboard is shared with stakeholders, can be easily shared through local systems. Doesn’t guarantee data security. |
| Data Source | Works with multiple data sources. Can fetch data from everywhere. | Works with limited data sources. |
Where Excel scores over Power BI
- Familiarity and ease of use: Excel is widely used by professionals of most industries, and many have the expertise or skillset to use it for quick computations and analysis. With Excel, they can work with data without facing a new learning curve from scratch.
- Ad hoc analysis and data manipulation: With over 400 available functions, Excel makes custom calculations and computations a breeze. You can easily combine multiple functions for complex on-the-spot calculations, data sorting, filtering, or manipulations.
- Financial modeling and forecasting capabilities: Excel’s built-in functions, such as NPV, IRR and PMT, help to create quick forecasts or financial modeling based on historical and predicated values.
- Basic reporting and data presentation for smaller datasets: Where you just need basic graphs or charts for interpretation of smaller datasets, Power BI is an overkill and Excel does just fine. Excel helps in straightforward data presentation with charts, tables and conditional formatting.
- Offline access and editing capabilities: Local or offline access to spreadsheets is one of the primary factors for Excel’s success. There are many scenarios where internet access may be unavailable, or not preferred.
Where Power BI scores over Excel
- Enhanced data visualization and interactivity: Power BI dashboards offer a wider range of visualization options than possible with Excel. It also offers interactivity so users can create visually informative dashboards to convey data insights that are easy to understand.
- Integration with multiple data sources for a comprehensive view: Connects easily to hundreds of data sources from any location, any type and can fix data quality and formatting issues quickly. It makes it easier for users to aggregate and display data in a more comprehensive way.
- Advanced analytics for deeper insights: Power BI has support in-built for advanced analytic tasks like machine learning, predictive modeling and others. It makes it easier to uncover insights from data and back decisions with facts.
- Real-time and near-real-time data analysis: Power BI gives real-time insights to make timely decisions. It enables users to track KPIs and always be knowledgeable about latest happenings and changes.
- Scalability for large datasets and Big Data processing: With the capability to process large and unstructured datasets, Power BI scores over Excel in processing Big Data. It is suitable for organizations that need to process huge amounts of data on short notice.
Conclusion
Both Excel and Power BI, are quite comprehensive systems for data analysis. While Excel is great for data crunching, Power BI is great for data presentation for enterprise- level systems. Also, both tools have an ecosystem of add-ons, plugins and extensions for integration with other tools. It may be a good approach to evaluate your needs as an individual or an organization before choosing one. Ask:
- Why do you need advanced data analytics?
- Is cost an issue?
- Do you need attractive visuals?
- How well are you managing Big Data?
To summarize, if you are stuck in choosing between these two tools, you need to be extremely clear of what tasks you have to perform, what insights do you need, and which tool will fit your specific needs.
Power BI has a steeper learning curve, but it is built from the ground up to handle big data, while Excel is more user-friendly, but lacks scalability, and has limited advanced analytical capabilities and also data integrity issues. Where large-scale data analysis, collaboration and visualization are vital for business operations, Power BI is the better choice. For smaller and faster tasks, Excel is more convenient.